
It would be relatively easy to fix our fiscal mess: In search of political leadership
- 10.25.24
- Economy & Policy
- Commentary
Chief Economist Eugenio J. Alemán discusses current economic conditions.
Talking and exchanging communication with advisors and clients over the last several years has shown that many of them are concerned about the fiscal path of this country and the consequences it is having on our debt. Most of these advisors and clients are concerned that not acting is bad for their investments and they are probably correct. At some point, the tables will turn and when they do, it will be game over. We have written a whitepaper about the U.S. debt, a white paper that we recently updated and republished.
As we argued in that paper, the decision to get our house in order is fundamentally a political decision. Furthermore, the effort to stabilize the growth in the debt should not be that difficult if anybody involved is willing to sit down and look at the problem and its potential solution.
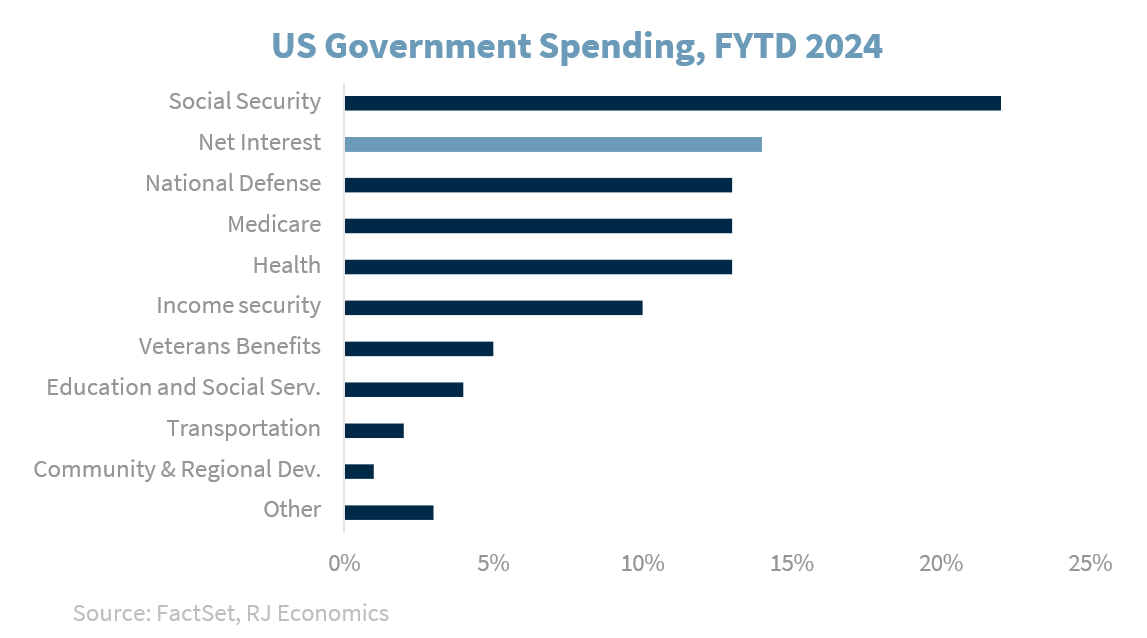
The fact that interest rate payments on the U.S. debt have increased so much since the burst in inflation after the pandemic recession should have put more pressure on the political system, i.e., the Republicans and the Democrats, to grab the bull by the horns. However, have you heard any political party or any one of the politicians at the top of the ticket talking about how to solve the issue? We have not. We sometimes hear some talk in the U.S. Congress, but it sounds more like lip singing than serious talk. The only thing that we hear is how much they are either going to reduce taxes or eliminate taxes for some sectors, on one side and, on the other, increase spending for a plethora of new programs.
We understand that politicians are, in some sense, similar to salespeople: they just have to package whatever they are selling in order for consumers (voters) to vote for them. We also understand that increasing taxes and/or reducing spending or even slowing down spending growth, is not in their best interest of ‘buying votes.’
But the effort we would have to make to stabilize the growth of the U.S. debt is not that ‘taxing’ in terms of either higher taxes or lower spending, and or a combination of both. Furthermore, the fact that we have a two-party system should ease the way to finding common ground to achieve the objective. We know that, in principle, Republicans don’t want to increase taxes. In fact, Republicans not only don’t want to increase taxes but what they want is to decrease taxes further, but nothing is said about expenditures. Meanwhile, the opposite is true for the Democrats, they want to increase taxes and increase expenditures.
The problem is that both Republicans and Democrats know that if they do the opposite of what they are looking for or try to agree on a negotiated middle they will probably lose voters because the economy is probably going to slow down. So, they don’t do anything and continue with the status quo.
But if we have leaders willing to negotiate in good faith, the negotiations should be very easy, and because it is a negotiation, both are going to have to give up on their demands, and the public, i.e., the voters, will probably blame both parties for a negotiated solution and thus they can move forward with their political lives.
Furthermore, although U.S. taxes as well as tax receipts have gone up and down over the decades, federal tax receipts as a percentage of GDP have remained relatively stable but with a hint of a downward trajectory as shown by the graph below.
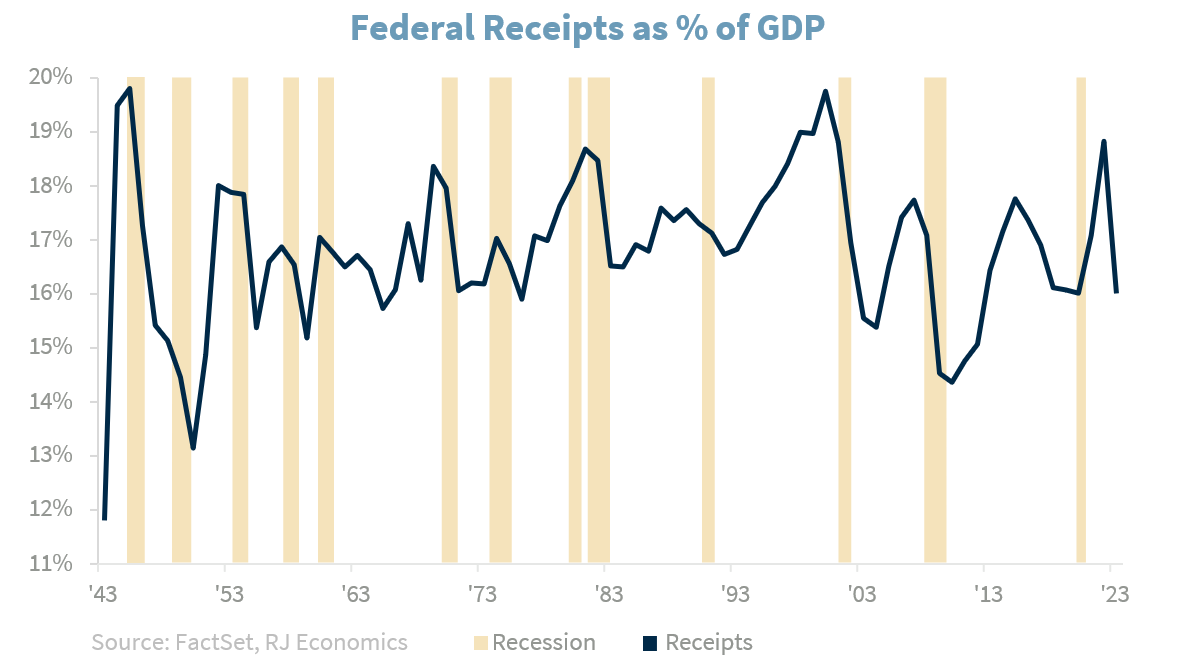
At the same time, it is important to point out that these federal government tax receipts as a percentage of GDP include social security taxes, which have hovered around at about 6% of GDP. Thus, federal government tax receipts as a percentage of GDP have been about 10% to 12%.
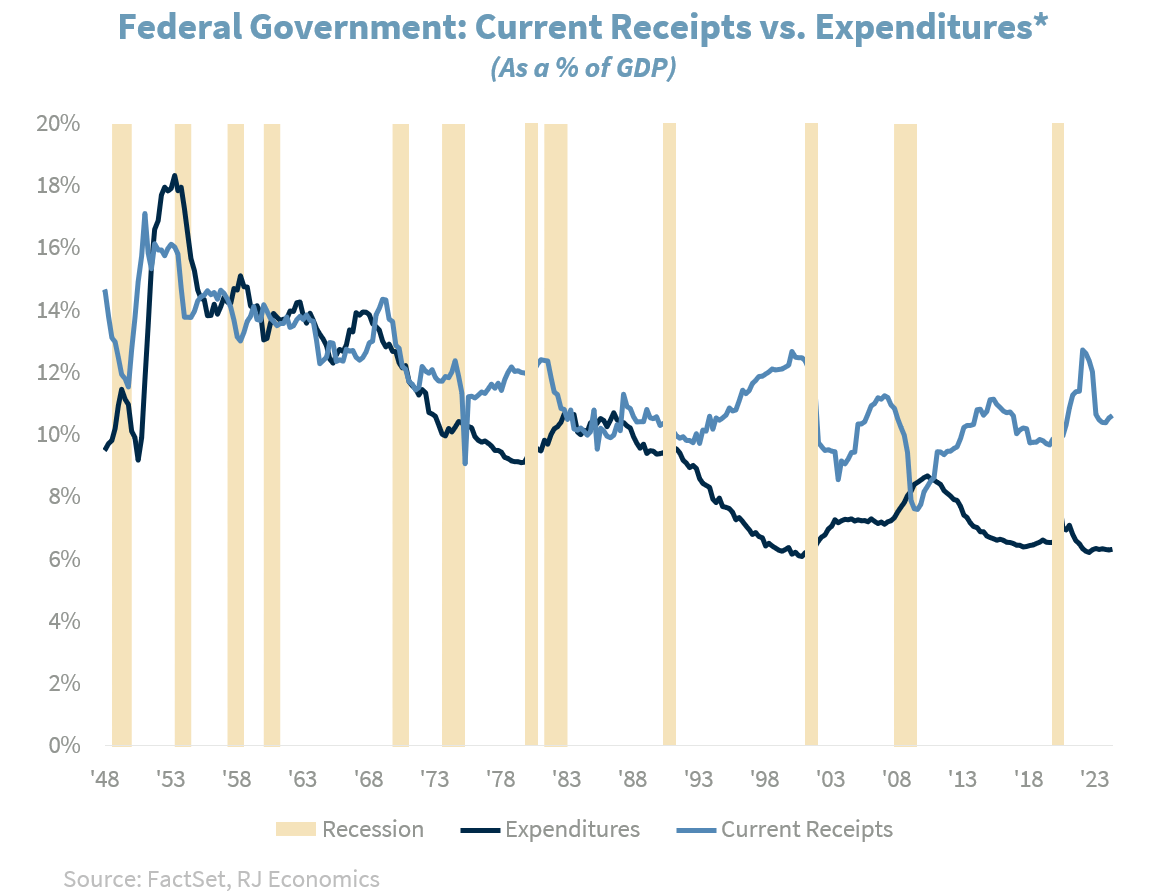
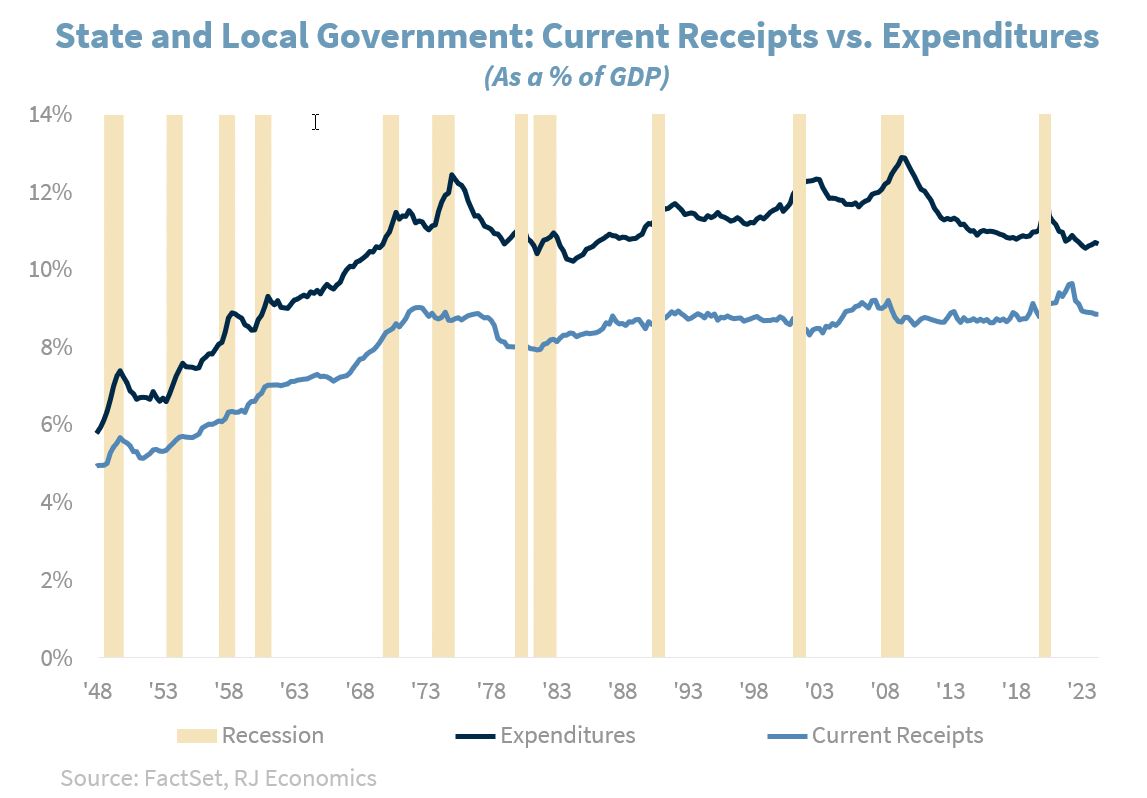
Another approximately 10% of GDP represents local and state taxes for total tax receipts as a percentage of GDP of about 26% to 27%. On the other hand, federal government expenditures and gross investment as a percentage of GDP have been close to 6% of GDP, from a high of about 18% of GDP in the aftermath of the Second World War. Of course, taxes as a percentage of GDP are not enough to cover all government needs and thus we need to figure out the path forward, which will probably include some cuts or a slowing down of expenditures plus higher taxes.
Meanwhile, state government tax revenues are not enough to cover state government expenditures, and thus the federal government must transfer resources to the states. According to the Federal Budget in Pictures1, federal transfers to state and local government represented about $1.1 trillion in 2023, down from about $1.2 trillion the previous year.
Some of these transfers are used to help the less fortunate across the country, they subsidize education, housing, and healthcare, as well as financing infrastructure buildup and upkeep and other expenses.
Thus, the solution to the federal fiscal imbalance cannot come just from the federal government, it is also something that needs to involve state and local governments. Furthermore, the solution is not easy only because of our highly ideological and broken political environment, which makes any solution very difficult.
However, if we look at what other governments in the world collect as a percentage of GDP and what they spend as a percentage of GDP, the solution to our debt problem should be a walk in the park! A case in point is France. France’s tax collections as a percentage of GDP were about 46% (at all levels of government, which includes social security contributions) while government expenditures as a percentage of GDP were about 58.3% of GDP in 2022. Thus, compared to France, the solution to our fiscal malaise and the growth in our debt, as we said above, should be a ‘walk in the park.’
Economic and market conditions are subject to change.
Opinions are those of Investment Strategy and not necessarily those of Raymond James and are subject to change without notice. The information has been obtained from sources considered to be reliable, but we do not guarantee that the foregoing material is accurate or complete. There is no assurance any of the trends mentioned will continue or forecasts will occur. Last performance may not be indicative of future results.
Consumer Price Index is a measure of inflation compiled by the US Bureau of Labor Statistics. Currencies investing is generally considered speculative because of the significant potential for investment loss. Their markets are likely to be volatile and there may be sharp price fluctuations even during periods when prices overall are rising.
Consumer Sentiment is a consumer confidence index published monthly by the University of Michigan. The index is normalized to have a value of 100 in the first quarter of 1966. Each month at least 500 telephone interviews are conducted of a contiguous United States sample.
Personal Consumption Expenditures Price Index (PCE): The PCE is a measure of the prices that people living in the United States, or those buying on their behalf, pay for goods and services. The change in the PCE price index is known for capturing inflation (or deflation) across a wide range of consumer expenses and reflecting changes in consumer behavior.
The Consumer Confidence Index (CCI) is a survey, administered by The Conference Board, that measures how optimistic or pessimistic consumers are regarding their expected financial situation. Current Situation Index (CSI) and Future Expectations Index (FEI) are the end-results of CCI, covering economic conditions, employment, price, income, and expense. The reading is 100 plus the average of said five factors
Certified Financial Planner Board of Standards Inc. owns the certification marks CFP®, CERTIFIED FINANCIAL PLANNER®, CFP® (with plaque design) and CFP® (with flame design) in the U.S., which it awards to individuals who successfully complete CFP Board's initial and ongoing certification requirements.
Links are being provided for information purposes only. Raymond James is not affiliated with and does not endorse, authorize or sponsor any of the listed websites or their respective sponsors. Raymond James is not responsible for the content of any website or the collection or use of information regarding any website's users and/or members.
GDP Price Index: A measure of inflation in the prices of goods and services produced in the United States. The gross domestic product price index includes the prices of U.S. goods and services exported to other countries. The prices that Americans pay for imports aren't part of this index.
The Conference Board Leading Economic Index: Intended to forecast future economic activity, it is calculated from the values of ten key variables.
The U.S. Dollar Index is an index of the value of the United States dollar relative to a basket of foreign currencies, often referred to as a basket of U.S. trade partners' currencies. The Index goes up when the U.S. dollar gains "strength" when compared to other currencies.
The FHFA House Price Index (FHFA HPI®) is a comprehensive collection of public, freely available house price indexes that measure changes in single-family home values based on data from all 50 states and over 400 American cities that extend back to the mid-1970s.
The Pending Home Sales Index (PHSI) tracks home sales in which a contract has been signed but the sale has not yet closed.
Supplier Deliveries Index: The suppliers' delivery times index from IHS Markit's PMI business surveys captures the extent of supply chain delays in an economy, which in turn acts as a useful barometer of capacity constraints.
Backlog of Orders Index: The Backlog of Orders Index represents the share of orders that businesses have received but have yet to start or finish. An increasing index value usually indicates growth in business but shows that output is below its maximum potential.
Import Price Index: The import price index measure price changes in goods or services purchased from abroad by
U.S. residents (imports) and sold to foreign buyers (exports). The indexes are updated once a month by the Bureau of Labor Statistics (BLS) International Price Program (IPP).
ISM Services PMI Index: The Institute of Supply Management (ISM) Non-Manufacturing Purchasing Managers' Index (PMI) (also known as the ISM Services PMI) report on Business, a composite index is calculated as an indicator of the overall economic condition for the non-manufacturing sector.
Consumer Price Index (CPI) A consumer price index is a price index, the price of a weighted average market basket of consumer goods and services purchased by households.
Producer Price Index: A producer price index (PPI) is a price index that measures the average changes in prices received by domestic producers for their output.
Industrial production: Industrial production is a measure of output of the industrial sector of the economy. The industrial sector includes manufacturing, mining, and utilities. Although these sectors contribute only a small portion of gross domestic product, they are highly sensitive to interest rates and consumer demand.
The NAHB/Wells Fargo Housing Opportunity Index (HOI) for a given area is defined as the share of homes sold in that area that would have been affordable to a family earning the local median income, based on standard mortgage underwriting criteria.
Conference Board Coincident Economic Index: The Composite Index of Coincident Indicators is an index published by the Conference Board that provides a broad-based measurement of current economic conditions, helping economists, investors, and public policymakers to determine which phase of the business cycle the economy is currently experiencing.
Conference Board Lagging Economic Index: The Composite Index of Lagging Indicators is an index published monthly by the Conference Board, used to confirm and assess the direction of the economy's movements over recent months.
New Export Index: The PMI new export orders index allows us to track international demand for a country's goods and services on a timely, monthly, basis.
Durable Goods: Durable goods orders reflect new orders placed with domestic manufacturers for delivery of long- lasting manufactured goods (durable goods) in the near term or future.
Source: FactSet, data as of 9/20/2024
